17. Appendix: GMOS WaveMapper
17.1. Purpose and scope
The WaveMapper is a tool to adjust the central wavelength for the standard longslit, IFU-R and IFU-2 modes of GMOS-N and GMOS-S. It is not part of the MOS mask creation process. However, it utilizes the mathematical models developed for GMMPS, and shares a substantial part of the GMMPS source code. WaveMapper comes bundled with GMMPS v1.4.0 or later, and is available in Skycat as a separate menu item after the installation of GMMPS.
The WaveMapper facilitates optimal central wavelength (CWL) choices, such that important spectral features do not get lost to detector gaps, boundaries, and bad columns (GMOS-S).
The following configurations are supported for GMOS-N/S:
Mode |
Grating |
|---|---|
Longslit, IFU-R, IFU-2 |
R150, R400, R831, B600, B1200 |
Longslit, IFU-R, IFU-2 |
R150, R400, R831, B600, B1200 |
17.2. User Interface
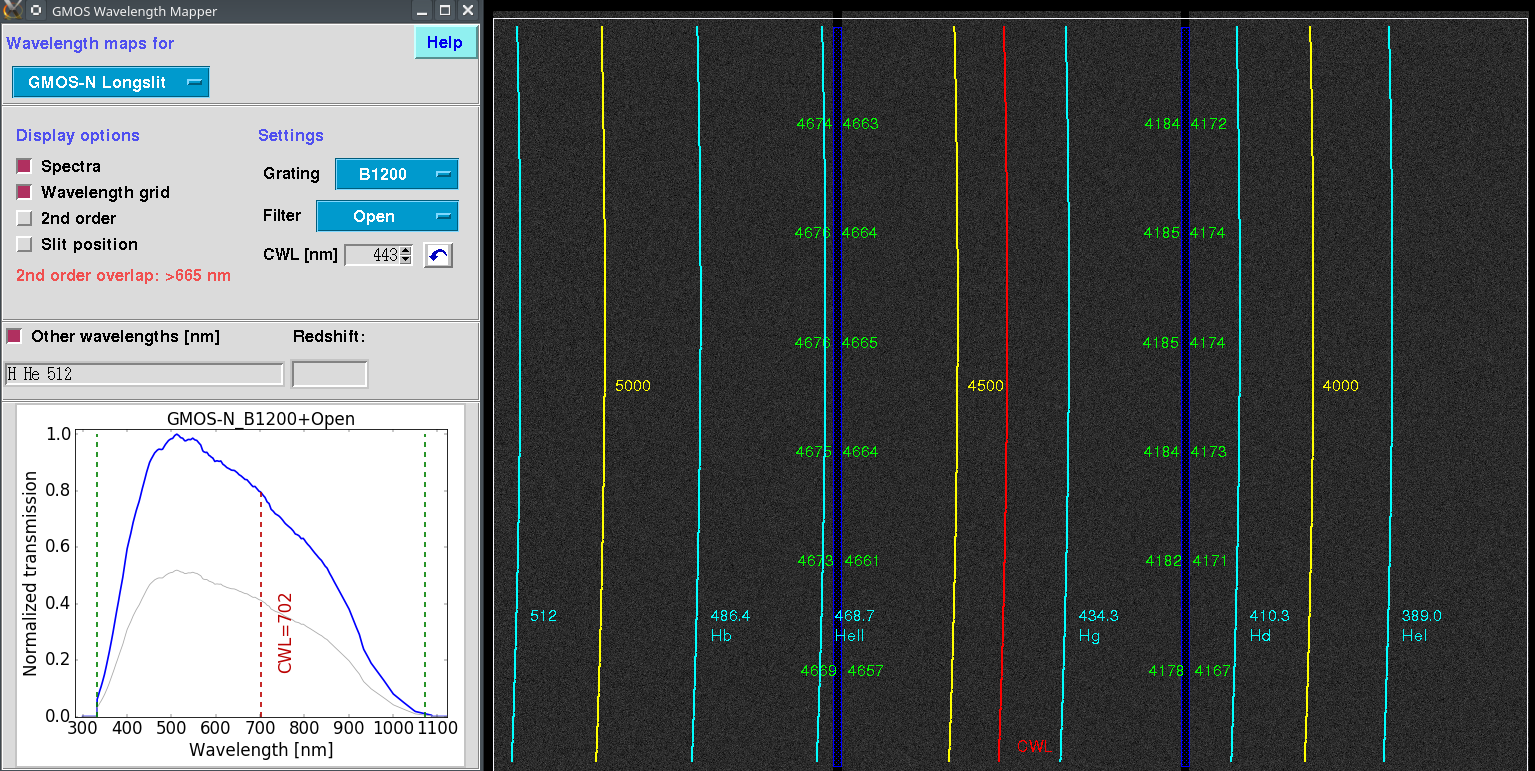
Fig. 17.1 The WaveMapper user interface. The control panel (left) offers a range of display options, which are then shown on top of the GMOS image (right panel).
Select the configuration you want to analyze. GMOS-N/S and their respective longslit, IFU-R and IFU-2 modes are available. Upon selection, a (2x2 binned) background image will be shown with the correct detector size and gap positions.
Select the grating, and optionally a filter. WaveMapper will display the normalized (blue) and absolute (gray) throughput curves, including contributions from the grating, filter, detector, and the atmosphere. The CWL will be set to the midpoint of the effective bandpass.
Warnings will be issued in the following cases:
Occurrence of 2nd order overlap. Wavelengths will be indicated. You may then select a suitable order sorting filter.
Overlap of the two spectral banks for the IFU-2. This is always shown as a red hashed area (see examples below). Some of the IFU-2 configurations have significant overlap rendering the entire central detector (or more) useless. Yet these can be very useful if one is just interested in single emission lines that fall into the clean areas.
Overlap of the 2nd order of the right spectral bank with the first order of the left spectral bank. There is not much you can do about that, because you already have a filter in the beam to accommodate both spectral banks on the detector.
Display options:
Spectra: Activates the display, and shows the extent of the spectrum (or the two spectra in case of the IFU-2.)
Wavelength grid: Enables the wavelength overlays. Displays a regular wavelength grid of yellow lines with numeric wavelength labels. Also displays a red line for the CWL, and the wavelengths of the detector gaps. Note how the gap wavelengths change as a function of detector y-position because of optical aberrations.
Use the CWL spinbox to see the effect of different CWL settings.
Second order: Toggles off/on the second order overlap, if any. This will be shown as a orange hashed area.
Slit position: Shows a green vertical line indicating where on the detector the long-slit, IFU-R and IFU-2 slits fall.
Other wavelengths [nm] / redshift: Takes a blank-separated list of user-defined wavelengths and / or the atomic identifiers used in GMMPS. The wavelengths will be displayed using a cyan color. Optionally, they can be redshifted.
17.3. Useful IFU-2 configurations
The CWL ranges listed below may be adjusted somewhat if only small wavelength ranges or single emission lines are of interest. The screen-shot wavelength maps are for GMOS-S and the default CWL that allows for equal wavelength coverage of both spectral banks (about midway of the given min-max range). Maps are very similar for GMOS-N.
Grating |
Filter |
CWL min-max |
Overlap |
Wavelength maps |
|---|---|---|---|---|
B600 |
u |
350–410 |
– |
|
B600 |
g |
420–550 |
small |
|
B600 |
g+GG455 |
450–550 |
– |
|
B600 |
r |
580–680 |
small |
|
B600 |
r+RG610 |
610–700 |
– |
|
R400 |
r |
570–700 |
– |
|
R400 |
i |
710–850 |
– |
|
R400 |
z |
890–980 |
small |
|
R400 |
CaT |
780–920 |
– |
|
B1200 |
u |
350–400 |
– |
|
B1200 |
g+GG455 |
490–530 |
medium |
|
B1200 |
g+OG515 |
510–550 |
– |
|
B1200 |
r+RG610 |
630–680 |
medium |
|
R831 |
r |
600–680 |
large |
|
R831 |
r+RG610 |
620–700 |
small |
|
R831 |
i |
750–800 |
large |
|
R831 |
i+RG780 (GMOS-S) |
750–850 |
small |
|
R831 |
i+CaT |
750–850 |
small |
|
R831 |
z+CaT |
860–930 |
medium |
Note
The characterizations of the spectral bank overlap tabulated above are approximate. They depend on where the throughput bandpass is set to start and end (fixed at 1% of the maximum relative throughput). If very bright spectral features are present outside this bandpass, then they may still be visible in the other spectral bank. This can easily be recognized in the exposures because the spectra of the right bank are offset downwards by about 5 pixels with respect to the left bank (for e.g. GMOS-S).